

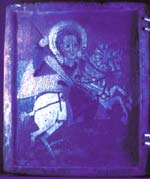
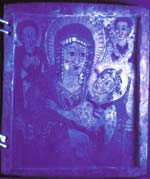
94-21-1. left panel under ultraviolet light
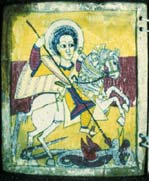
94-21-1. left panel, infra-red image
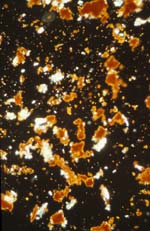
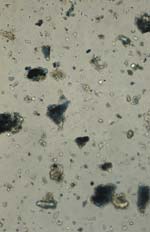
94-21-1 sample of gypsum ground and cinnebar/vermillion pigment under crossed polars at 200X magnification.
Spectra of chemical elements present in sample of green earth pigment from 94-21-1 (detail)
Fourier Transform Infrared Spectroscopy (FTIR)
Science: Glossary of Technical Analyses
Ultraviolet (UV) light: usually, restorations reflect or absorb light in the UV range differently from original materials. Thus, their presence is frequently detectable via use of this low technology method. The conservator routinely examines artifacts under ultraviolet light to view the presence of coatings, varnish, and restorations such as fill materials and overpaint.
Case study: icon 94-21-1: on this object, no varnish or restorations are visible under UV light. Varnishes and coatings typically fluoresce white, yellow, pale green, or orange. Overpaint most typically absorbs ultraviolet light yielding a blackish color.
Infrared (IR) photography: a tungsten lamp is fitted with a filter to block out all light wavelengths except for those in the infrared region of the spectrum and a special infrared-sensitive film is used to capture the infrared image. Materials have their own infrared signatures and will look different under these conditions. Infrared rays penetrate paint layers better than visible rays. Thus, the conservator uses this method primarily to view underdrawings which are often executed in charcoal or graphite, both of which are carbon-based materials. Carbon-based materials absorb light in the IR region yielding the black outlines of the drawing.
Case study: icon 94-21-1: on this object, no changes were made from the underdrawing to the final composition. The prominent black outlines on this IR image are a result of outlining over the underdrawing. Note to the viewer: The color changes visible on the infrared image are a result of the filter over the light; thus red appears to be green and green appears to be blue.
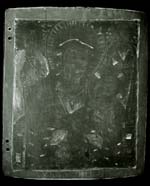
X-radiography: this method records the different densities of materials by passing a beam of X-rays through an artifact which is resting on a large sheet(s) of film. Those rays that penetrate the artifact are recorded on the film as black areas and those rays that do not penetrate because the materials are denser (radio-opaque) are recorded on the film as white areas. Gray areas represent partial penetration of the rays which is dependant upon the density of the material. The conservator uses this method to view internal damage, techniques of manufacture, changes in composition, and the use of radio-opaque materials.
Case study: icon 94-21-1: on this object, the white areas record the densest pigment used to paint the image. Vermilion, used for the red areas, is made of mercury sulfide. Because mercury is a heavy metal with a high density, the X-rays did not penetrate the vermilion areas; they are therefore said to be radio-opaque.
Polarized light microscopy (PLM): is used to study particles and fibers in both transmitted light (which passes through the sample) and reflected light at magnifications up to 1000X. The conservator uses this method to qualitatively identify pigments and fibers based on particle size, morphology, and reflectance properties.
Case study: icon 94-21-1: on this object all eight of the colors were sampled for identification by PLM. A sample taken from the red background of the right panel shows particles of the white gesso ground (gypsum) and red pigment (vermilion) at 200X magnification under crossed polars. The orange "haloes" around the red particles aid in identification of the pigment as vermillion.
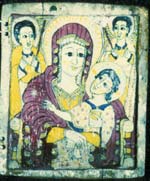
PLM is particularly effective for viewing individual particles in mixtures. Both the blue areas of the Virgin's robe and the green area on the dragon have pigment mixtures. The blue is a mixture of indigo, the predominant colorant used, and smalt, a trace colorant. Smalt is a potassium cobalt oxide glass, which began to be used as a blue pigment in the late 16th century. The green area was identified as a mixture of orpiment, indigo and green earth an iron, magnesium, aluminum, and potassium silicate pigment. Green earth is a pure green pigment. Greens can also be created via mixing blues and yellows. Indeed, the green colors on all of the other NMAfA icons were achieved by mixing blue (indigo) and yellow (orpiment).
Elemental Analysis: can be accomplished with scanning electron microscopy coupled with energy dispersive spectroscopy (SEM-EDS). This method enables viewing of the sample under very high magnification (up to 50,000X) and identification of the chemical elements present in samples. An electron beam moves across the sample which causes the emission of secondary X-rays characteristic of specific chemical elements. The wavelengths of these X-rays are analyzed by an energy-dispersive detector. The resulting data lists the chemical elements present in major, minor, and trace quantities. When the conservator applies this method to pigment analysis it is used to identify the chemical elements present in the pigment or to confirm the qualitative identification of a sample by PLM.
Case study icon 94-21-1: all of the pigments on this object were identified by PLM and then the identification was confirmed by elemental analysis. This confirmation was important for the green earth sample, because this green paint was only used on one icon. With an unusual finding, it is particularly important to verify the results.
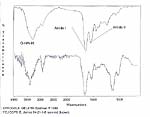
Fourier Transform Infrared Spectroscopy (FTIR): this method characterizes organic materials by measuring the wavelengths and frequencies of their molecular bond vibrations and comparing the resulting spectrum with a database of known materials. Organic substances can be categorized (i.e. alcohols, gums, waxes, proteins, etc.) but not precisely identified by this method. The conservator uses FTIR to characterize coatings, varnishes, binders, and adhesives. This characterization aids in understanding the artist's materials and in treatment formulation.
Case study: icon 94-21-1: a sample of the paint was submitted to FTIR to characterize the binding medium. The sample's spectrum matched most closely with the spectra of proteinaceous materials. Proteins are found in all materials of animal origin and are characterized by FTIR by their nitrogen-hydrogen (N-H) bonds. Note the peaks in the ranges 1630-1690 cm-1 and 3300-3500 cm-1 which indicate the different bond formations for the N-H substances present. In particular, the sample matched most closely with the spectrum for animal glue; this characterization corroborates oral history accounts of the materials used by Ethiopian icon painters.
94-21-1. right panel under ultraviolet light
94-21-1. right panel, infra-red image
94-21-1, right panel, x-ray
94-21-1 sample of mixture of smalt and indigo pigments at 200X magnification.
Chemical elements present in sample of green earth pigment from 94-21-1.